Module 4: Plotting with ggplot2
Build publication-quality figures using the Grammar of Graphics.
Learning objectives — After this module you will be able to:
- Understand the layered Grammar of Graphics
- Build scatter plots, bar charts, histograms, box plots, and line graphs
- Map data variables to visual aesthetics (color, size, shape)
- Add trend lines, error bars, and text labels
- Customize axes, colors, legends, and themes
- Use
facet_wrap()andfacet_grid()for multi-panel figures - Save publication-quality figures with
ggsave()
4.1 The Grammar of Graphics
ggplot2 builds plots layer by layer using a consistent grammar. Every plot has the same basic structure:
ggplot() +
  geom_<TYPE>(data = <DATA>, aes(x = <X>, y = <Y>)) +
  scale_*() +
  labs() +
theme_*()| Component | Purpose |
|---|---|
ggplot() |
Initializes the plot |
geom_*() |
The geometric shape used to represent data |
aes() |
Maps data variables to visual properties |
scale_*() |
Controls axis scales, color palettes, sizes |
labs() |
Title, subtitle, axis labels, captions |
theme_*() |
Non-data visual appearance (font, grid, background) |
Layers are added with +, which is similar to the |> operator
4.2 Setup
library(tidyverse)
library(lubridate)

# Load the clean dataset from Module 3
track         <- readRDS("data/processed/track.rds")
sightings     <- readRDS("data/processed/sightings.rds")
environmental <- readRDS("data/processed/environmental.rds")
4.3 Bar Plot — number of sightings events of each species code
ggplot() +
  geom_bar(data = sightings, aes(x = speccode))+
  labs(x = 'Species Code', y = "Sightings Events")+
  theme_bw()

# ggsave("figures/bar_plot.png", width = 8, height = 5, dpi = 300)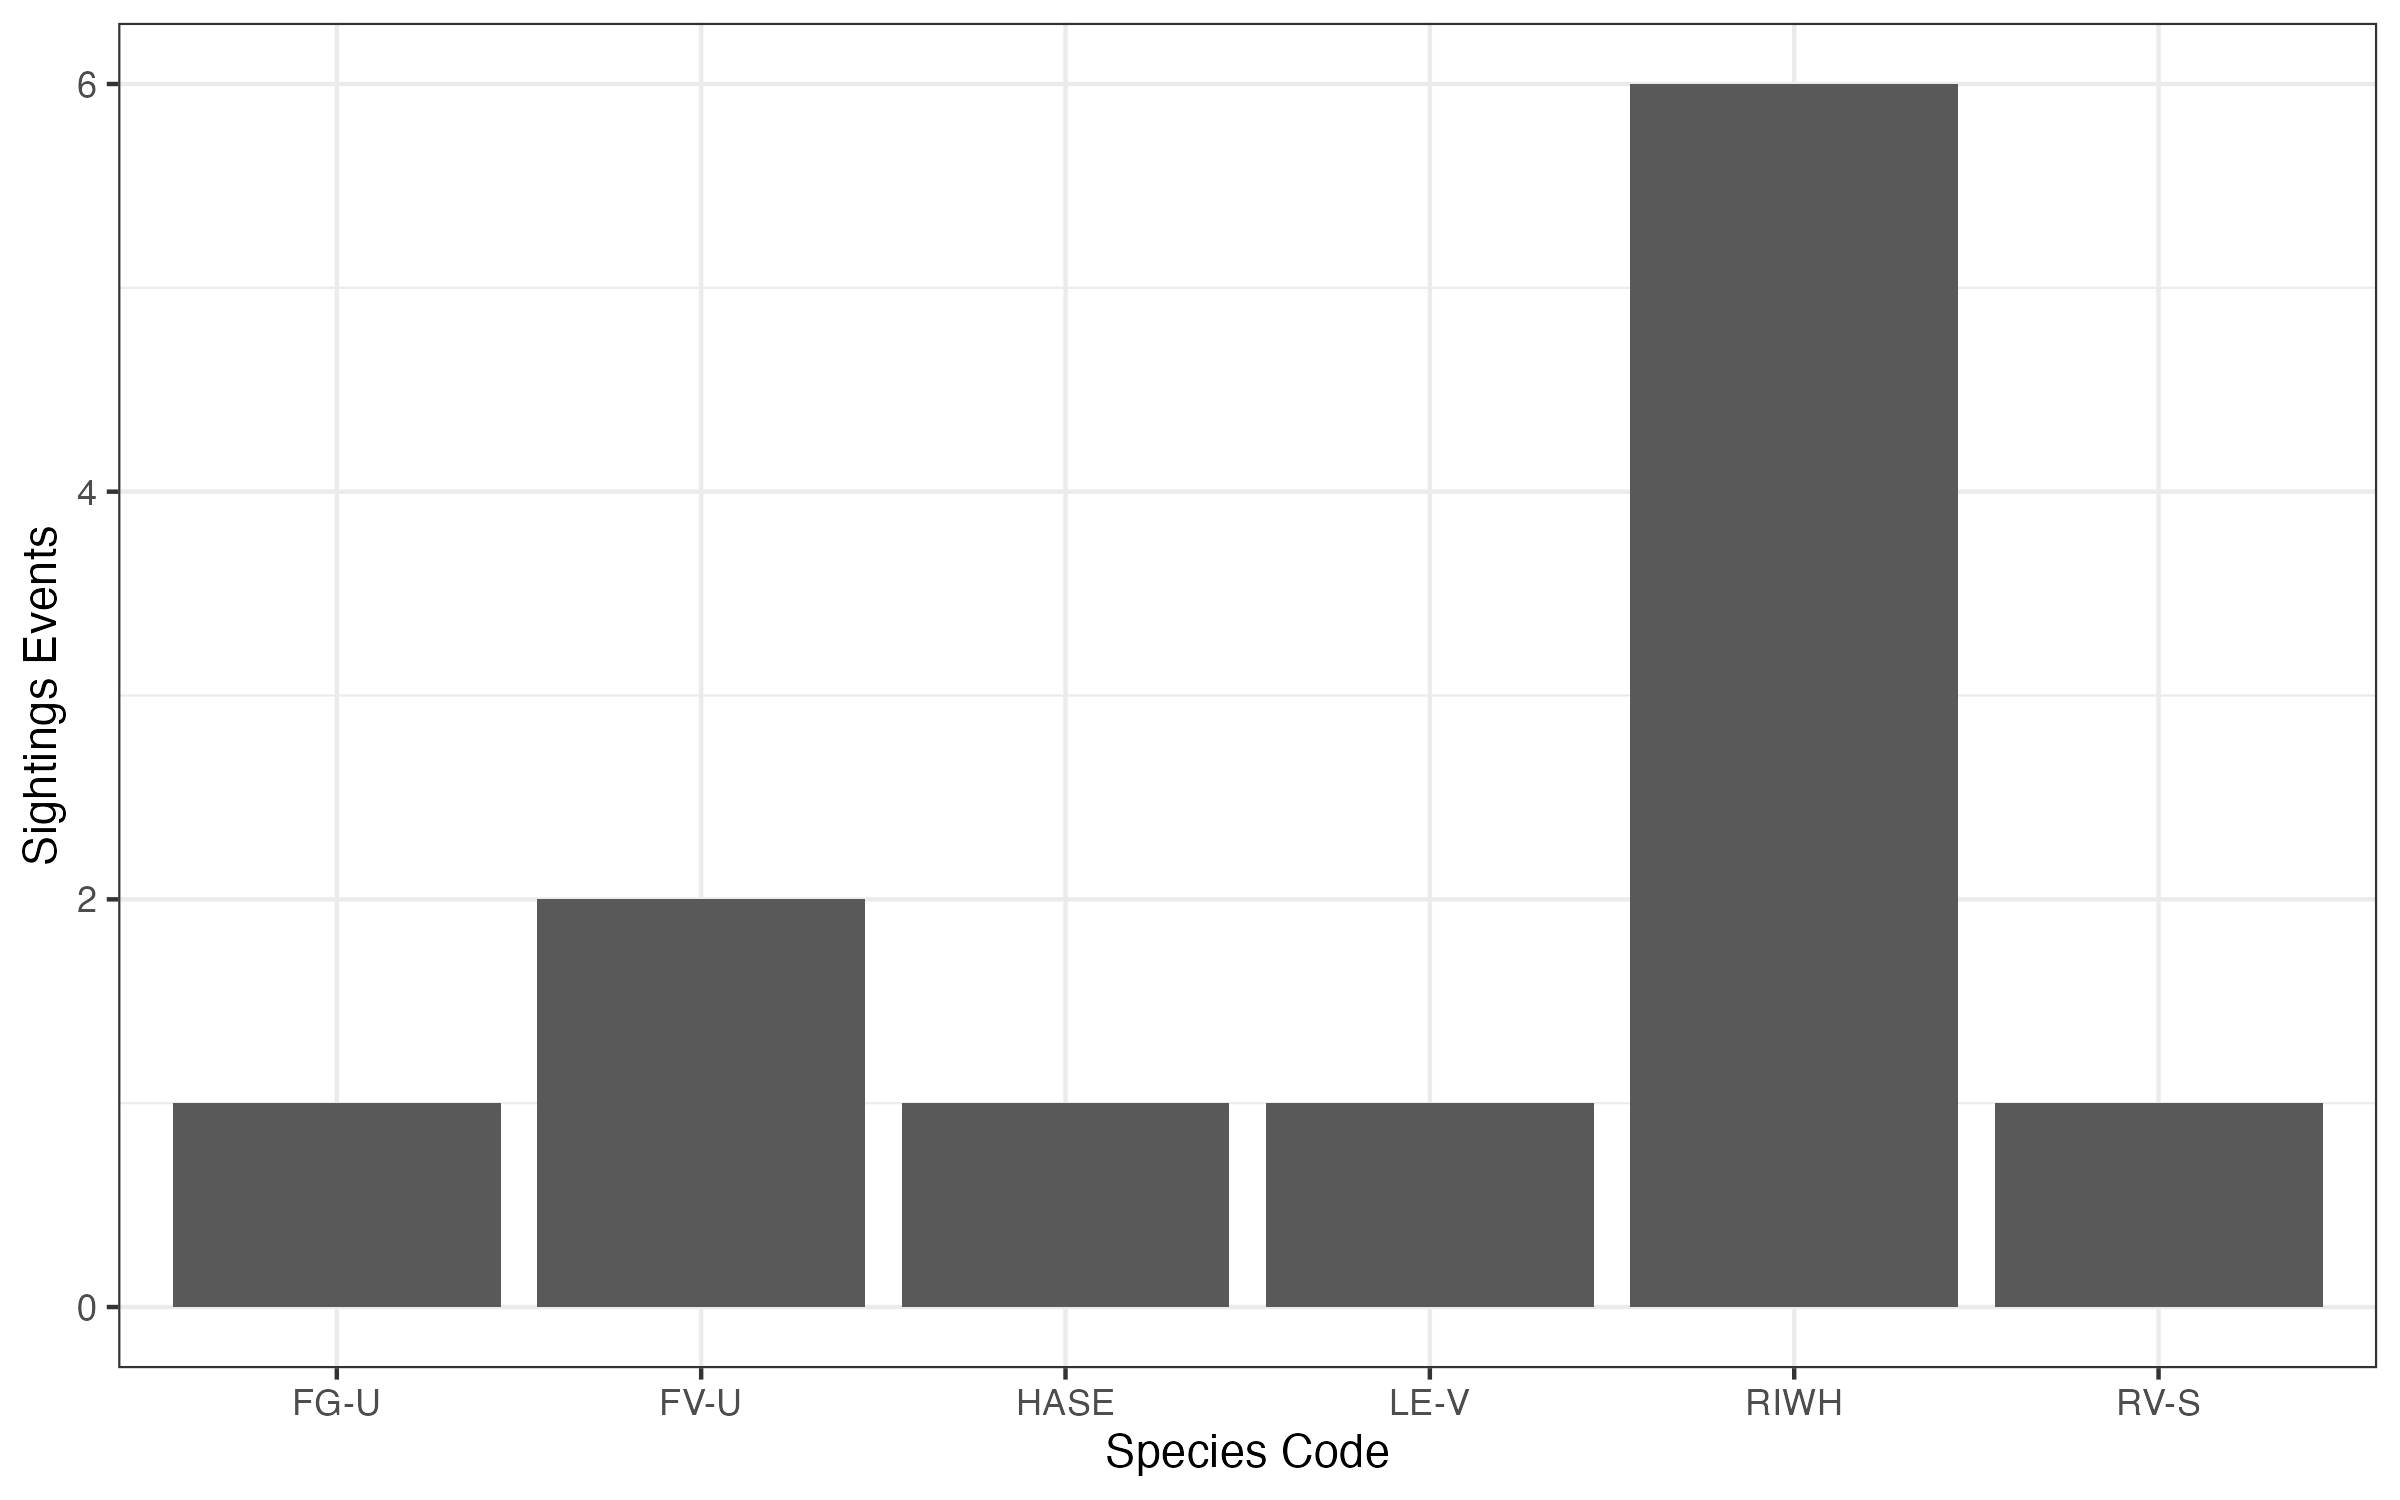
4.4 Scatter plot - vessel speed over time
ggplot() +
  geom_path(data = track, aes(x = datetime_edt, y = speed_kts), alpha = 0.6)+
  labs(x = 'Time (EDT)', y = 'Vessel speed (kts)')+
  theme_bw()

# ggsave("figures/scatter_plot.png", width = 8, height = 5, dpi = 300)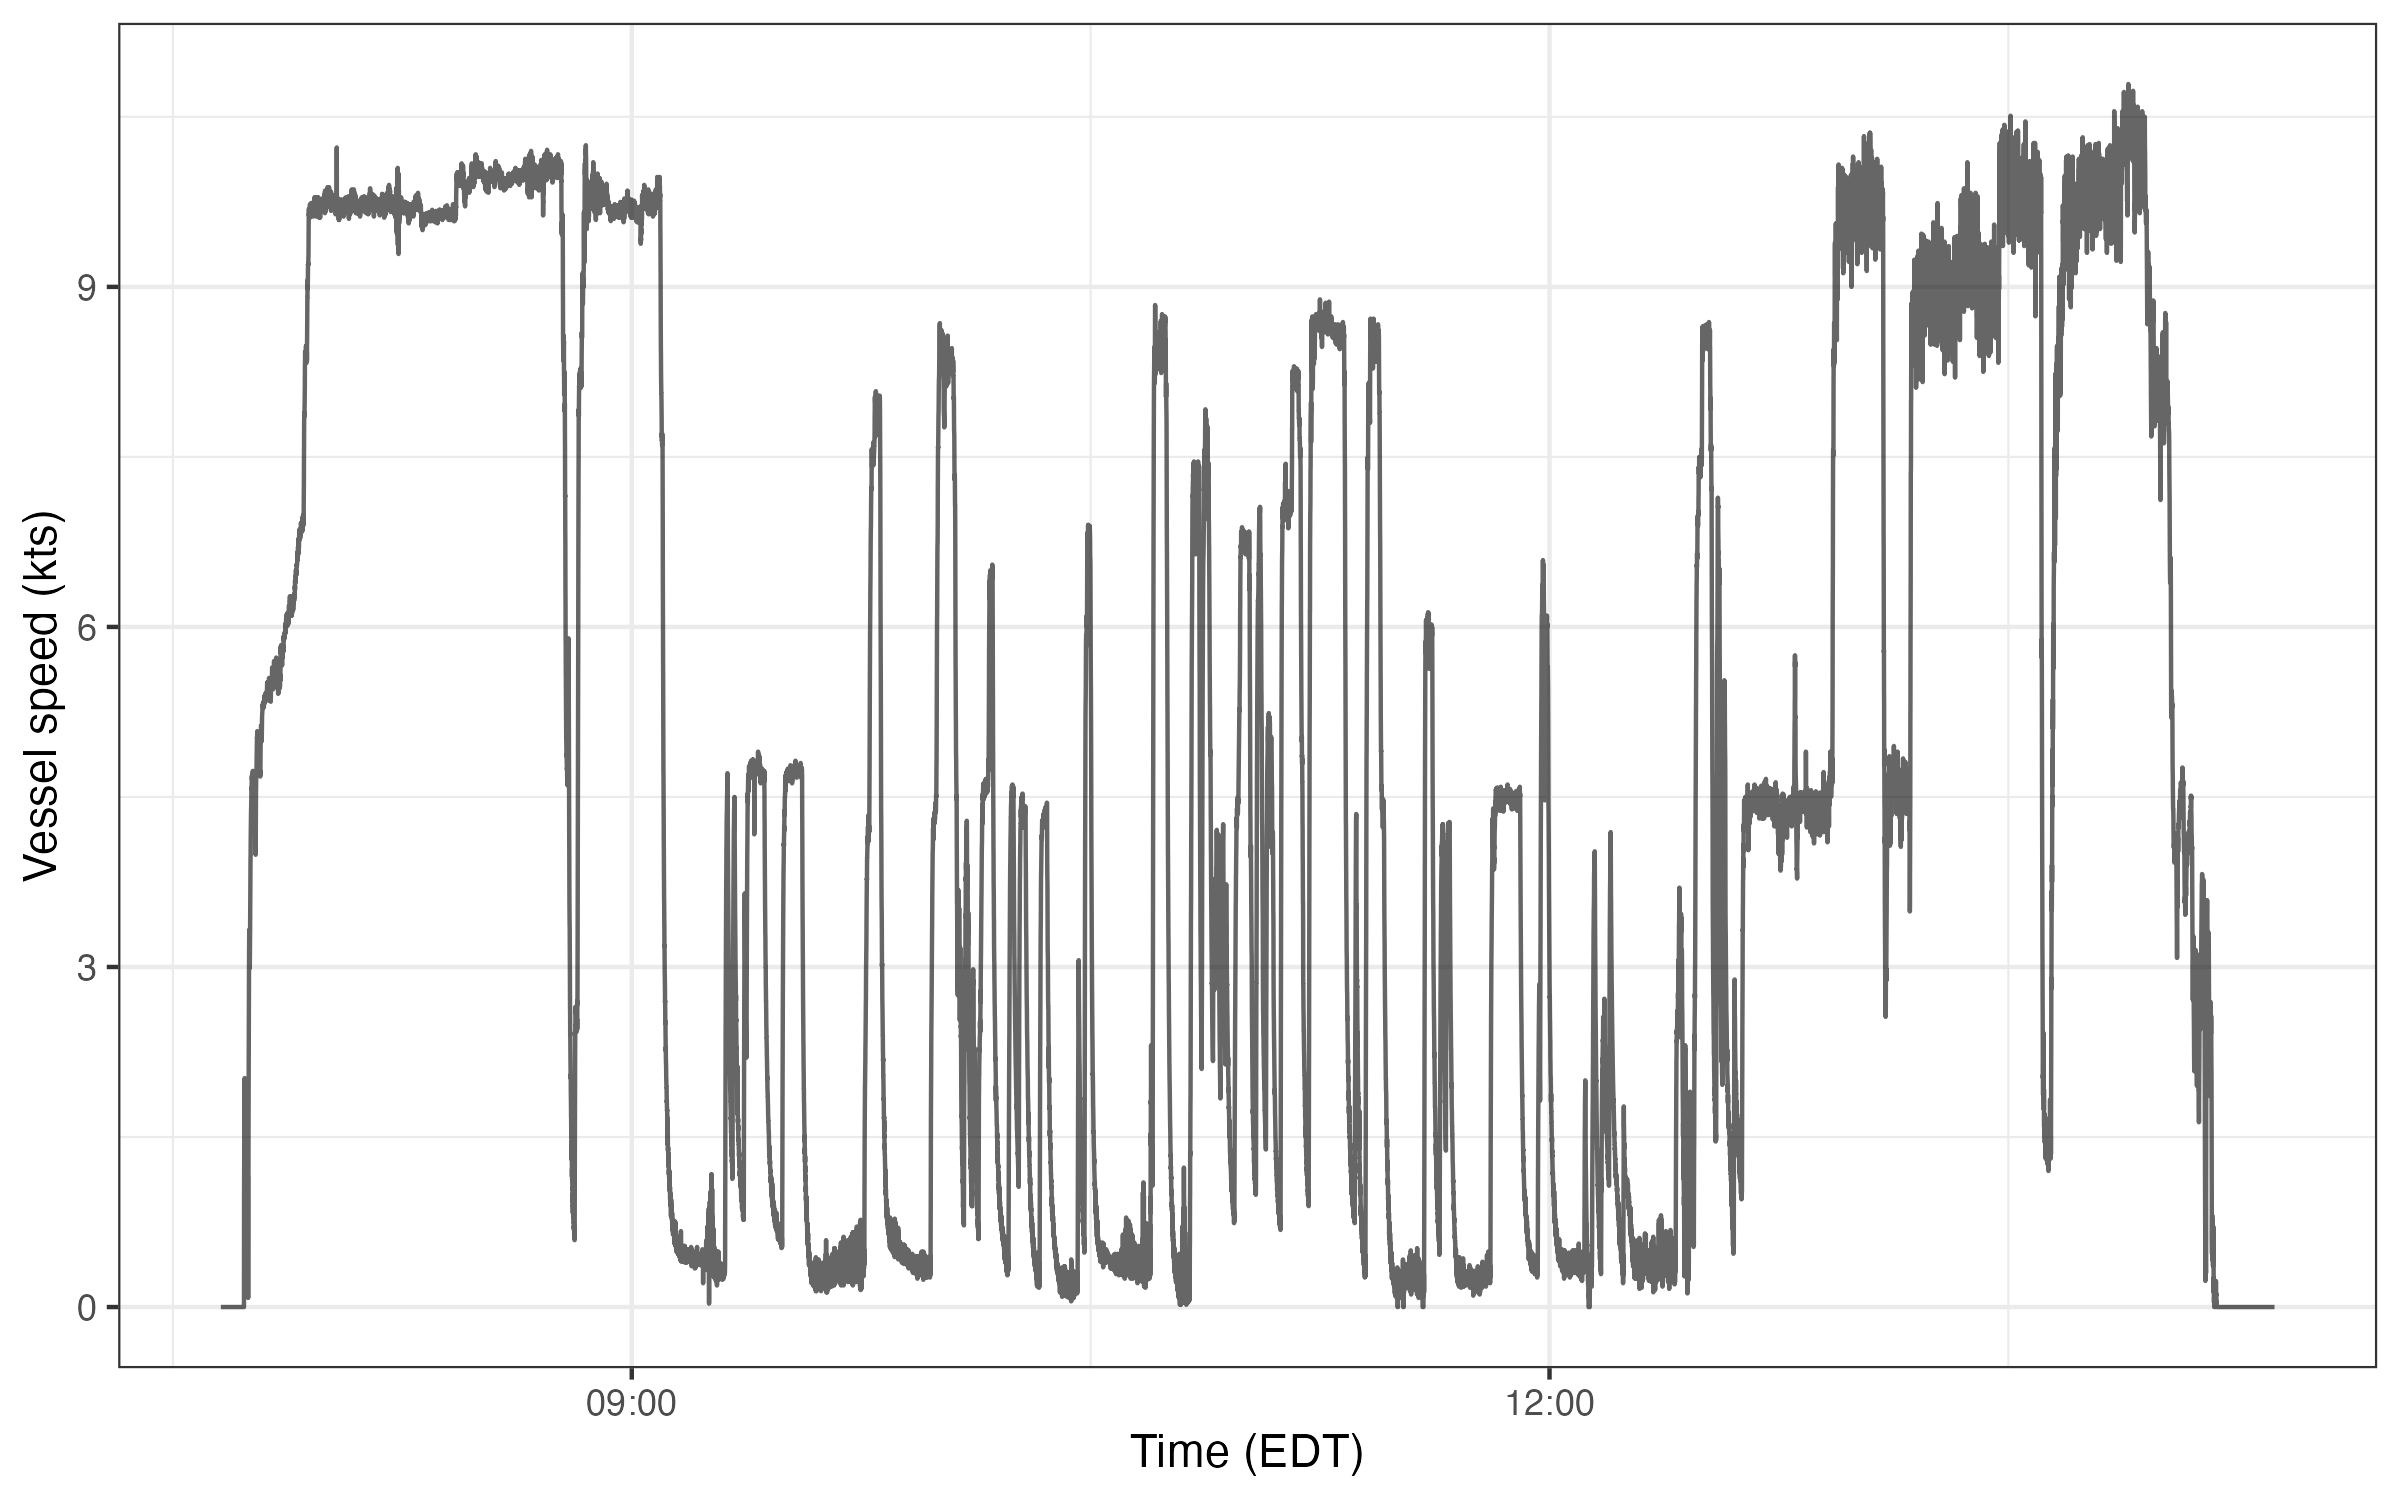
4.5 Survey Maps
4.5.1 Basic map
Plot a quick map of track line and right whale sightings locations:
ggplot() +
  geom_path(data = track, aes(x = longitude, y = latitude), alpha = 0.5)+
  geom_point(data = sightings |> filter(speccode == 'RIWH'),
             aes(x = longitude, y = latitude), alpha = 0.7)+
  coord_quickmap()+
  labs(x = NULL,
       y = NULL,
       title = "Right whale sightings")+
  theme_bw()

# ggsave("figures/rw_map.png", width = 8, height = 5, dpi = 300)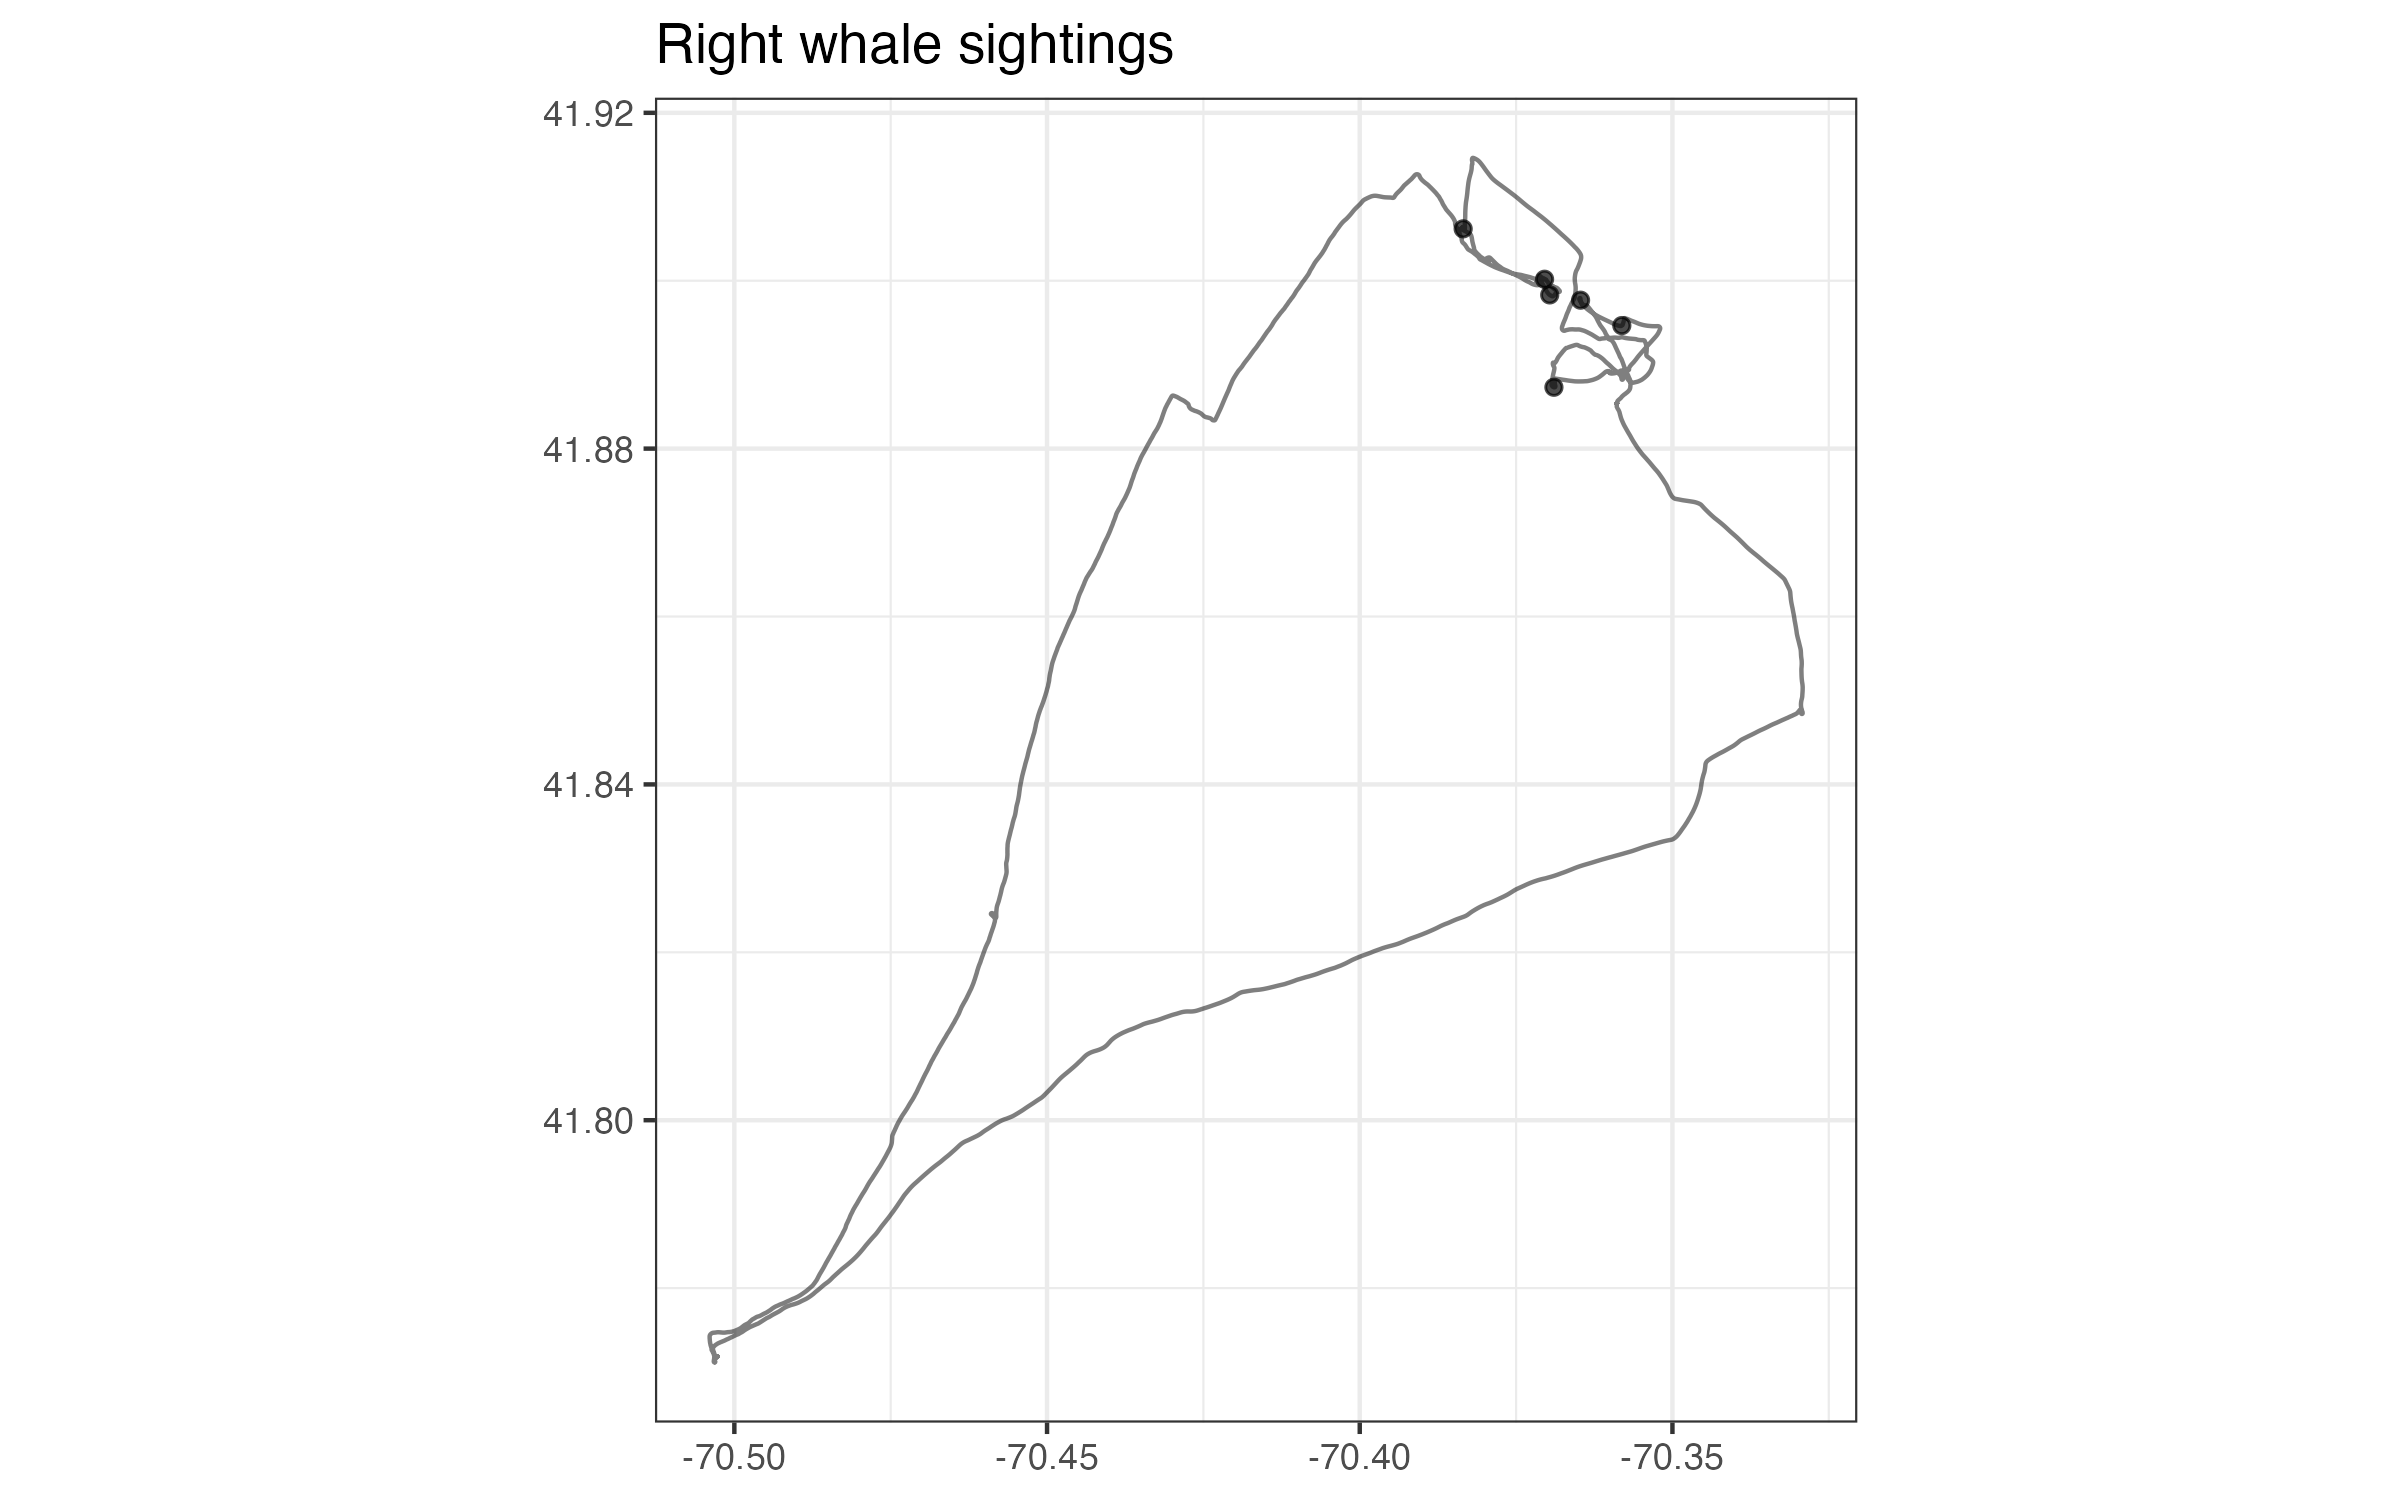
4.5.2 Plotting with sf
Use the sf package to improve mapping functionality. The following is a very simple example to add a coastline.
install.packages(sf)
library(sf)

# import the coastline sf object from my website
coastline_sf <- readRDS(url('https://hansenjohnson.org/files/data/sf-coastline.rds'))

# define the plot limits
buffer = 0.05
min_lon = min(track$longitude, na.rm = T) - buffer
min_lat = min(track$latitude, na.rm = T) - buffer
max_lon = max(track$longitude, na.rm = T) + buffer
max_lat = max(track$latitude, na.rm = T) + buffer

# plot
ggplot() +
  geom_sf(data = coastline_sf) +
  geom_path(data = track, aes(x = longitude, y = latitude), alpha = 0.5) +
  geom_point(data = sightings |> filter(speccode == 'RIWH'),
             aes(x = longitude, y = latitude), alpha = 0.7) +
  coord_sf(xlim = c(min_lon, max_lon), ylim = c(min_lat, max_lat)) +
  labs(x = NULL,
       y = NULL,
       title = "Right whale sightings")+
  theme_bw()

# ggsave("figures/sf_map.png", width = 6, height = 6, dpi = 300)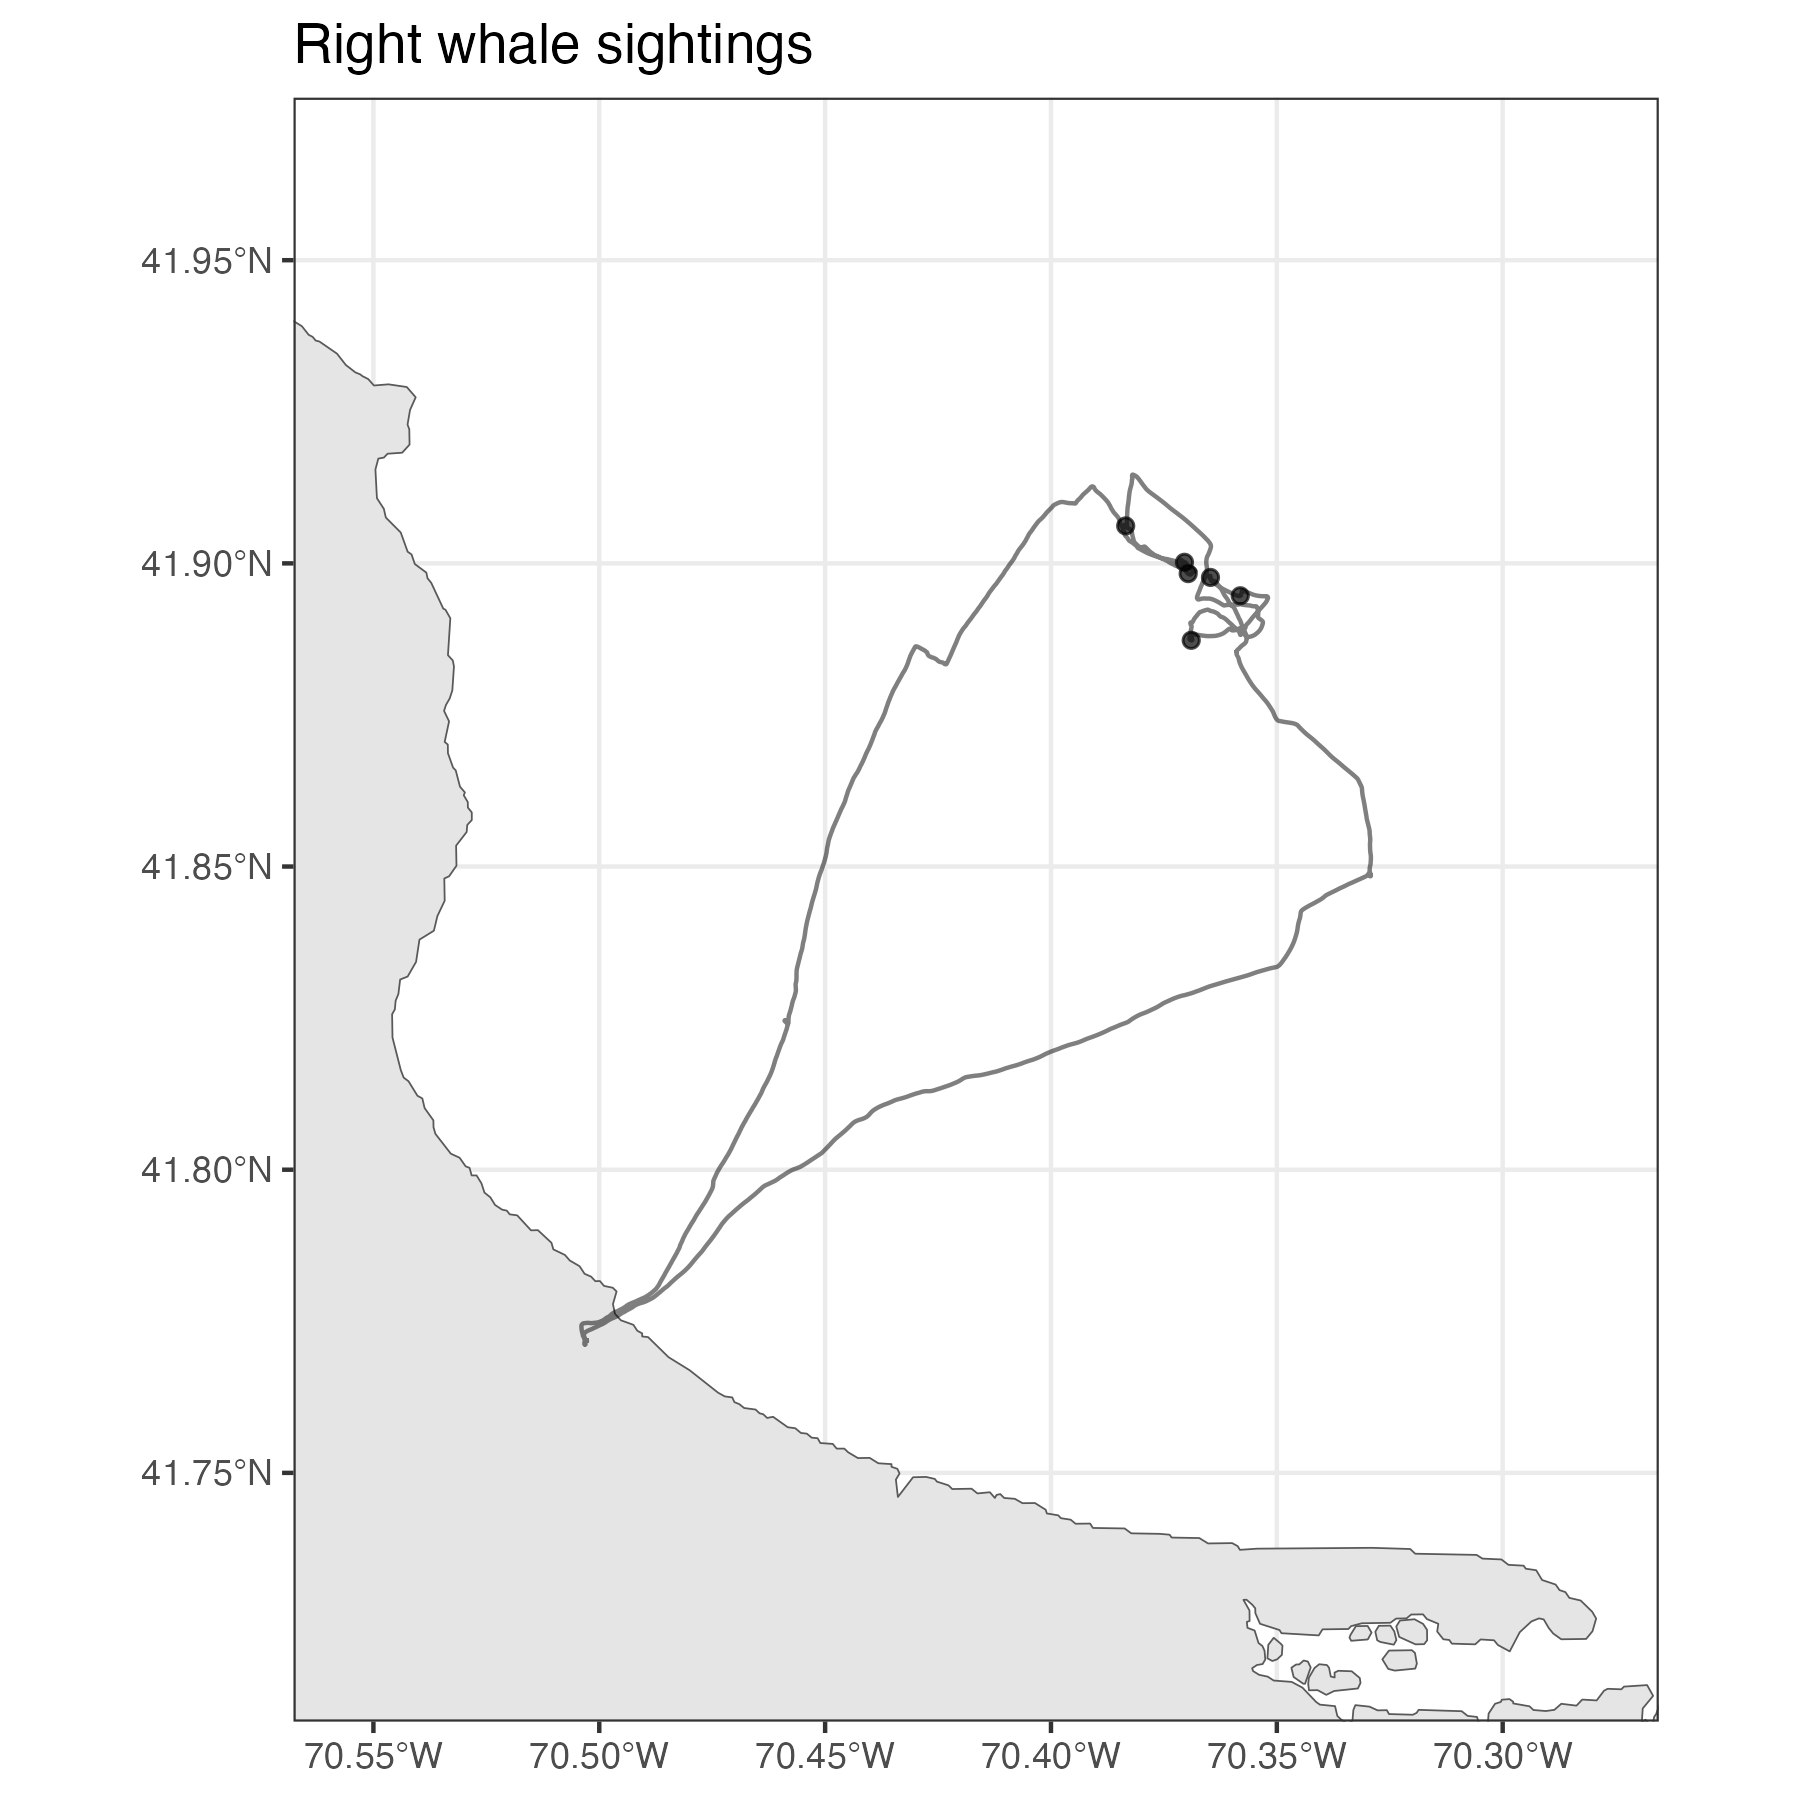
4.6 Saving Figures with ggsave()
# Save the last plot
ggsave("figures/survey_map.jpg",
       width = 8, height = 5, dpi = 300)

# Save a named plot object
p <- ggplot() +
      geom_bar(data = sightings, aes(x = speccode))

ggsave("figures/lame-bar-plot.pdf", plot = p,
       width = 6, height = 4)   # PDFs are vector graphics — no dpi needed
Tip
Create a figures/ folder in your project before saving. For journal submissions use dpi = 300 (PNG) or vector formats (PDF/SVG). width and height are in inches by default.
Bonus: interactive map with leaflet
Use the leaflet package to plot an interactive map.
# Install the package if you haven't already
install.packages("leaflet")

# Load the library
library(leaflet)

# Create an interactive map
leaflet() |>

  # add tiles
  addProviderTiles("Esri.OceanBasemap") |>

  # add lines
  addPolylines(
    data = track,
    lng = ~longitude,
    lat = ~latitude,
    color = 'black',
    weight = 2,
    opacity = 0.6
  ) |>

  # add points
  addCircleMarkers(
    data = sightings,
    lng = ~longitude,
    lat = ~latitude,
    radius = 4,
    stroke = FALSE,
    fillOpacity = 0.6,
    popup = ~paste0(
      "Sighting number: ", number, "<br>",
      "Species code: ", speccode, "<br>",
      "Number: ", number, "<br>",
      "Time: ", datetime_edt
    ))
Tip
For more plot examples, check out the ggplot2 tutorial I built several years ago.
Note